

There is no retention without attention.
After all, retention rates — which measure app usage and loyalty — play a crucial role in optimization, monetization, and revenue forecasting. So if you’re not measuring this metric, pay attention to the fact that you really should.
Giving retention the attention it deserves also means constantly monitoring rates to ensure your campaigns are on track.
But, paying attention alone does not guarantee improved retention. Intense competition for installs across popular categories like Gaming, Shopping, Finance and high expectations for seamless digital experiences yields fewer opportunities for quick retention wins.
Indeed, during Q3 2022, Android retention on Day 14 was down 6.5% from Q3 2021. Android Day 30 retention rates saw a slightly steeper drop, declining 10.3%. Significant declines in Finance (-23%), Gaming (-20%), Shopping (-12%) Day 30 retention rates from Q3 2020 to Q3 2022 paint a similarly grim picture.
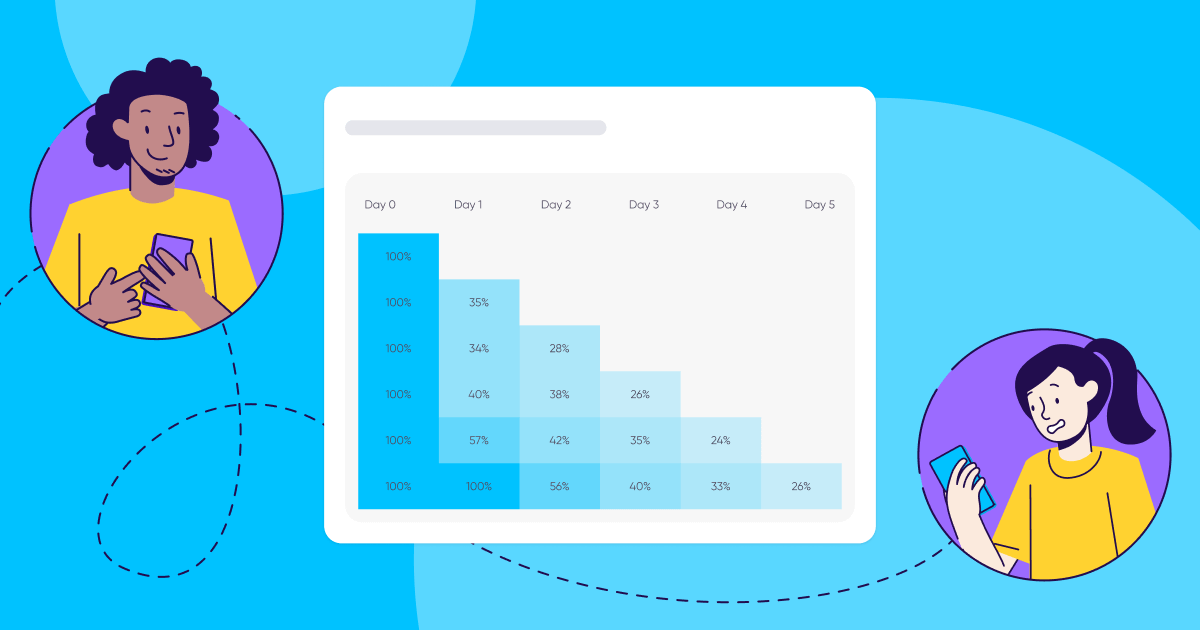
Explore app retention benchmarks – average and top 10%
On top of that, there is the challenge of privacy — namely the loss of user-level data and data signals beyond the first days of a campaign. It is no surprise that app marketers often feel as if they’re operating in the dark.
The reality is that relying on user-level data to measure and optimize campaigns is quickly becoming a thing of the past — currently in iOS and soon on Android. Instead, app marketers will have to be more savvy, taking advantage of new measurement methodologies to optimize user acquisition campaigns to pinpoint channels that drive loyal users.
While retention is currently difficult to measure on iOS devices, benchmark data continues to be a valuable resource based on data from consenting iOS users (although a minority, it’s not a negligible number), Android usage, and overall retention rates from organic and non-organic installs combined.
Owned media activities like push notifications, email, and SMS have become a crucial component of a comprehensive app marketing strategy, offering new opportunities to drive lifts in retention and long-term LTV of existing users.
The data used in this report covers 11 billion app installs across 11,000 apps in Q3 2022. Data is fully anonymous and aggregated. To ensure statistical validity, we follow strict volume thresholds and methodologies.
Global iOS retention mostly unfazed as Android retention marches downwards 10%
Across Q3 of the past 3 years, Android Day 1-30 retention rates have steadily declined. In Q3 2022, Android retention on Day 14 held at 4.3%, down 6.5% from Q3 2021. Android Day 30 retention rates saw a slightly steeper drop, declining 10.3%. There is little doubt that the Android app landscape is more competitive than ever, leaving users more distracted and less loyal to one particular app.
The onset of Covid-19 and home quarantines in 2020 boosted screen time across a larger selection of apps as consumers often got “bored” of their usual favorites and decided to explore competitor apps with tantalizing discounts.
iOS retention continues to hold steady with slight dips in 2022: retention rates have not changed much since 2020. With a 6.7% Day 14 retention rate, iOS apps saw retention decrease 1.5% year-over-year.
Day 30 retention, a key indicator of user loyalty, shifted from 4.5% to 4.3%. Day 30 Retention dipping below 4% would be cause for concern on iOS as we move into 2023 and beyond.
Rising star categories up 8-15% while competitive categories down 11- 32% in 2 Years
Star performers often get overshadowed by rising stars. After all, who doesn’t love a good growth story? We know that News is always the retention star performer, but that’s old news.
2022 was filled with breaking news stories across environmental, commercial and political spheres, giving News apps plenty of curious readers. While some users may choose to distance themselves from troubling news, the category-leading 11.3% retention rate of Q3 2022 showcases how many users are coming back to News apps for more.
Across app categories, we see Business, Music, Health & Fitness and Education apps as rising stars, with rising YoY Day 30 retention across both 2021 and 2022. Business Day 30 retention is up 10.9%, Health & Fitness is up 15.6%, Music is up 8.6% and Education is up 10.5% from Q3 2020 to Q3 2022.
We also see categories that did not perform as well, with declining YoY Day 30 retention across both 2021 and 2022. Photography is down 31.8%, with significant declines also seen in Finance (-23.3%), Gaming (-20%), Productivity (-20%), Entertainment (-16.7%), Social (-15.2%), Shopping (-12.3%) and Travel (-11.8%) from Q3 2020 to Q3 2022.
It is no surprise that these are the same categories showing impressive growth in installs year-over-year. With rising competition, apps within these categories will need to demonstrate their unique selling points if they wish to stand out and retain their users in the new year.
Japan is king at 5.1% while China languishes at 1.3% day 30 retention
Users in developing countries are always on the hunt for discounts of any kind. With this increased emphasis on price, we see less brand loyalty in developing countries, and consequently lower retention when compared to developed countries.
Developing countries like China, Brazil, India, and Vietnam saw considerably lower Day 30 retention in Q3 2022 at 2% or less. Low retention rates in such populous regions signals that rapidly growing smartphone usage does not automatically translate to increased retention.
On the flip side, Japan leads the pack of developed countries at 5.1%, almost 300% higher than China’s 1.3% Day 30 retention rate. Many developed countries hover around the 3% range, such as the United States, Canada, Australia and the United Kingdom.
Owned media remarketing surges past paid media remarketing in 2023
In Q3 2022, owned media remarketing campaigns, including push notifications, email, and SMS, drove a >100% lift to Day 30 retention rates across 6 categories: Social, Utilities, Gaming, Music, Entertainment and Photography. Only one category, Medical, reported a 6% decline in retention when using owned media. Owned media remarketing delivers higher retention rates and is practically free, but is much harder to scale.
Marketers are catching on – 2022 has seen tremendous demand for owned media remarketing campaigns that don’t hurt tight budgets and are not affected by platform privacy shifts. Many companies are doubling down on building a strong brand image, and owned media allows a bespoke channel of communication to both loyal and new users.
We see similar benefits for paid media remarketing campaigns, but with lower lifts than owned media. Only 3 categories showed a >100% lift with paid media remarketing campaigns: Utilities, Photography, and Gaming. Paid media remarketing is often cheaper than paid user acquisition campaigns, and is easily scalable, assuming you have the budget.
If your app marketing strategy is focused on retention instead of user acquisition, there is no doubt that spending time and energy on varied remarketing campaigns, especially with owned media, can yield great results. This is extra valuable for the categories with declining YoY retention rates like Gaming, Shopping, and Finance.
How to improve retention rates
With challenge comes opportunity. Yes, the competition is getting heated. Yes, users are more price-conscious than ever and have increasingly higher expectations. No, the situation is not impossible. Here are some ideas on how you can improve your user retention heading into 2023:
- Create superb UX: Strong retention rates begin with effective first time user experiences. Set realistic expectations with your users at the moment of install and deliver on what you promise. An exceptional user-experience plays a key role to drive ongoing customer loyalty and profitable LTV.
- Utilize deep linking: Make sure you use deep links in your UA campaigns, and deliver a seamless onboarding experience where users are taken directly to the content they are most interested in viewing. The goal is to streamline the customer journey, moving the user from advertisement to install to conversion without friction.
- Leverage owned media: Take advantage of your owned media sources such as push notifications, email and SMS campaigns to drive higher engagement and improved retention rates. Lifts in day 30 retention for apps that use owned media remarketing show that there is untapped potential for this medium in the coming years.
- Invest in re-engagement campaigns: Invest in consistent and value-driven re-engagement campaigns tailored to the user, beginning within a week of the install and continuing throughout the customer’s lifecycle.
- Embrace new measurement frameworks: In today’s privacy-centric reality, the main challenges in driving re-engagement campaigns are limited data, and the need to rely on aggregated data of user level metrics. Implementing measurement frameworks such as incrementality, predictive, and cohort analysis will help you plan, execute, and optimize your re-engagement strategy.
- Compare against benchmark retention data: If you haven’t already, begin leveraging a wider range of app metrics. Even though iOS user-level information and retention data may not be available, benchmark reports and Android app trends can offer valuable insights that can be used to build out retention strategies.